Peace has always had an economic value. The 2026 Global Peace Index reveals that a resumption of the Iran war could result in a US$2.2 trillion hit to the world economy.

When Operation Epic Fury began on 28 February 2026 with US and Israeli airstrikes targeting Iranian nuclear, military, and leadership infrastructure, the world’s attention turned to the military dimension of the conflict.
But behind every missile strike and drone swarm, a parallel war of economic disruption has been quietly reshaping the global economy. The 2026 Global Peace Index (GPI) provides the most comprehensive accounting yet of what this conflict is costing the world, and the numbers are sobering.
To understand the economic stakes of the Iran war, you need to understand the Strait of Hormuz. Just 33 kilometres wide at its narrowest point, it carries approximately 20 million barrels of crude oil and petroleum products per day, or roughly one-fifth of global petroleum consumption and over a quarter of all seaborne oil trade. It also transits around 20 per cent of global liquefied natural gas supply, Qatar’s entire LNG export capacity, for which no pipeline alternative exists.
When Iran closed the Strait in early March 2026, it triggered what the head of the International Energy Agency (IEA) described as “the greatest energy security challenge in history.” Some 13 million barrels per day of Gulf exports were immediately stranded. Saudi Arabia and the UAE managed to redirect a combined seven million barrels per day through alternative pipelines, but that still left an enormous shortfall, the largest supply disruption ever recorded in the global oil market. Iraq, Kuwait, Qatar, and Bahrain had no such escape route. Their oil and gas, normally a lifeline, became trapped.
The result is what the GPI calls the “Hormuz paradox.” Brent crude surged above US$100 per barrel in late April, reaching US$110 by mid-May. In every previous oil shock in modern history, rising prices at least meant a windfall for producers. But this time was different. The countries generating the price spike could not get their product to market. They were being hit twice over: cut off from export revenues at the very moment their import costs rose and their infrastructure was being bombed.
The GPI models the economic impact of the Iran war under three scenarios.
Under Scenario 2, the most likely near-term outcome, global GDP losses in 2026 are estimated at approximately US$1.3 trillion, or 0.6 per cent of world output. That figure sounds modest compared to the Global Financial Crisis (which cut world output by around 3.5 percentage points in its first year) or the COVID-19 pandemic (a 3.1 per cent contraction in 2020).
But the Iran war’s losses are not spread evenly across the global economy. They are concentrated on a small number of countries and income groups that can least afford them.
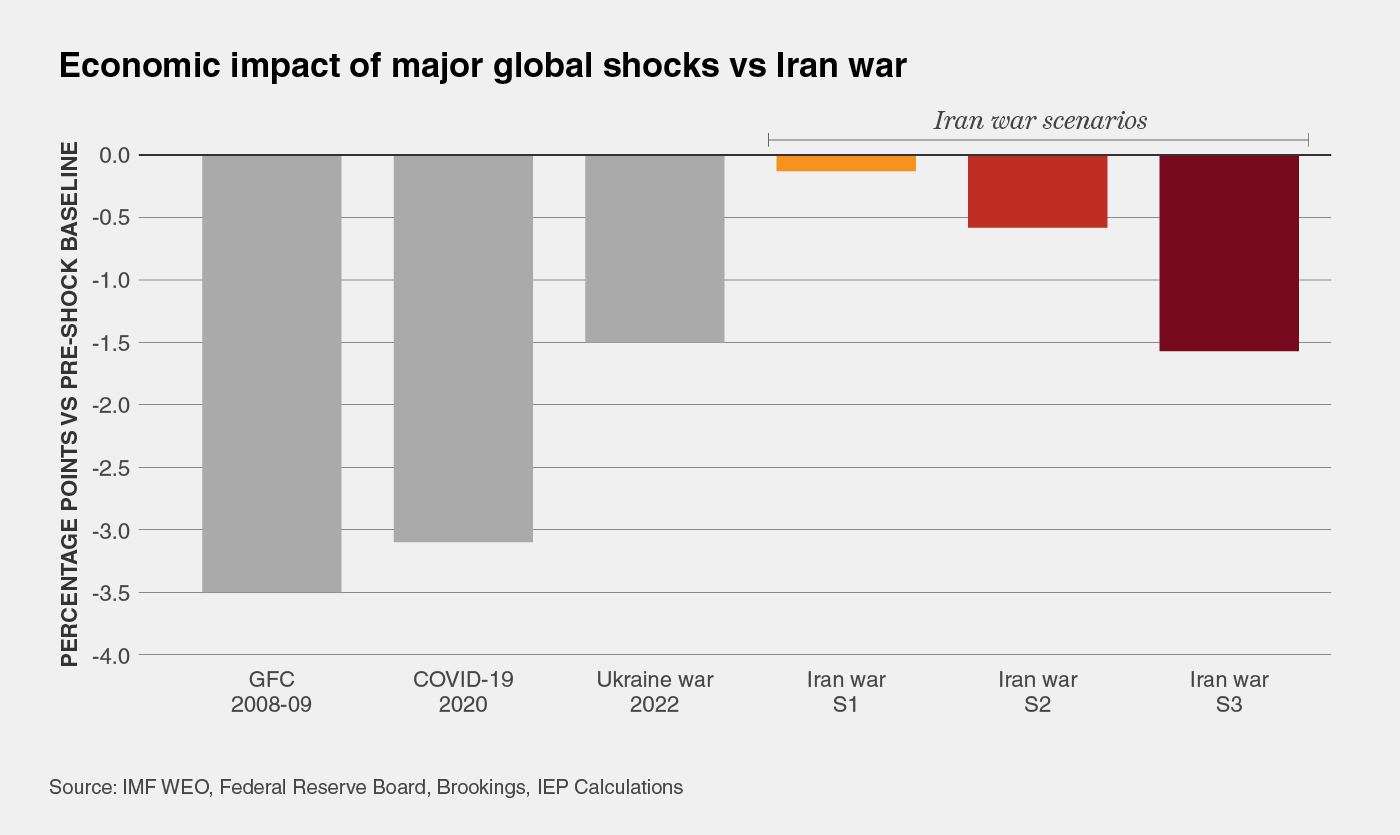
Should the war resume under Scenario 3, global GDP losses would climb to roughly US$3.5 trillion, which would exceed the economic shock of the Russia-Ukraine war in its first year. The gap between Scenario 2 and Scenario 3 amounts to approximately US$2.2 trillion. That figure, the GPI notes, is “the dollar value of diplomacy.”
The countries directly affected, Iran, Israel, and the Gulf states, face the steepest losses relative to their economies. Under Scenario 2, Iran could lose around 15 per cent of GDP. Iran cannot export oil, which normally provides roughly a quarter of its national income, at a cost of around US$435 million per day. Combined with extensive damage to refineries and nuclear infrastructure, the cumulative toll is severe. Qatar, whose entire LNG export capacity is stranded, faces losses of around 9 per cent of GDP under the same scenario. Across the Gulf group as a whole, Scenario 2 implies GDP losses of roughly 6.2 per cent.
Beyond the frontline economies, the war is transmitting its costs outward through four distinct channels: energy prices, trade and supply chains, financial markets, and remittances. The trade disruption alone has ripple effects far beyond the Gulf. Ships rerouting around southern Africa add roughly two weeks to delivery times. Freight rates and war-risk insurance premiums have risen sharply, in some cases more than tenfold. Modelling across 65 countries suggests that every additional week of disruption produces income losses in developing countries that cannot be recovered later.
The remittance channel is particularly consequential for some of the world’s most fragile economies. Workers in Gulf states send around US$88 billion home each year, with Egypt, Pakistan, Jordan, and India among the largest recipients. Egypt alone received US$41.5 billion in Gulf remittances in 2025, equivalent to roughly 10 per cent of its GDP. Within weeks of the conflict beginning, foreign investors withdrew around US$6 billion from Egyptian markets, the pound fell more than 8 per cent against the dollar, and the full remittance compression was still feeding through.
The Strait of Hormuz carries more than oil and gas. Gulf states supply approximately 45 per cent of global sulphur and 50 per cent of global urea exports, both critical inputs to fertiliser production. Qatar produces around 40 per cent of the world’s helium, an essential element in semiconductor manufacturing. All of these are now stranded.
The fertiliser shortage will not show up in food prices immediately. It works on a six-to-nine month lag, feeding into harvests after the Q2 2026 planting season across South Asia and East Africa. A 10 per cent increase in fuel prices raises food distribution costs by three to five per cent in import-dependent economies, with the burden falling hardest on the poorest households, for whom food already absorbs 50 to 70 per cent of income. The food crisis, in other words, is running on a timer, and it will peak at the same moment that several critically indebted countries face sovereign debt rollover deadlines.
Pakistan, Egypt, and Kenya face US$5.1 billion in combined debt maturities in November and December 2026 alone. Under Scenario 2, rolling these over at manageable interest rates is uncertain for all three. Under Scenario 3, it is effectively impossible.
The GPI’s analysis of fragile states reveals a particularly alarming concentration of risk. The energy shock is arriving at a moment when global government debt stands at 93 per cent of world GDP, higher than any peacetime year in the post-war era outside COVID-19. For many of the most exposed countries, the run of crises since 2020 has already exhausted the fiscal space that governments would normally use to absorb a commodity price surge.
Sri Lanka carries a debt-to-GDP ratio of 101 per cent and energy import dependence of 60 per cent. Pakistan, already in near-continuous IMF engagement since 2019, faces simultaneous shocks from higher fuel costs, rising food prices, and Gulf remittance compression worth four to five per cent of GDP. Egypt, the world’s largest wheat importer, is absorbing four channels of stress simultaneously: higher energy import costs, Suez Canal revenues that have fallen around 60 per cent as shipping reroutes via the Cape of Good Hope, tourism earnings erosion, and lower Gulf remittances.
For Sri Lanka, Scenario 3 would push debt-to-GDP close to 143 per cent by 2028, a level at which any IMF programme becomes unworkable without writing off a large share of what creditors are owed.
What makes the 2026 shock distinctive is not its headline size but the way multiple disruption channels interact simultaneously and reinforce one another. Every previous major oil shock produced winners somewhere: exporters could cash in on higher prices even as importers suffered. This time, the shock spreads simultaneously through energy, food, trade, remittances, and financial markets, and the countries that would normally serve as regional stabilisers are themselves among the most damaged.
The GPI’s estimates are described as intentionally conservative, sitting at the lower end of published forecasts. They do not fully capture financial contagion and longer-term demand destruction, which are the most likely sources of non-linear escalation. What the numbers do capture, clearly, is that the costs are not distributed in proportion to economic size. Groups 4 and 5, developing energy importers and advanced economies, absorb the largest losses in raw dollar terms simply because of their size, but the impact as a share of GDP is modest for them. It is the small, debt-laden, energy-dependent economies of the Gulf, the Levant, and South Asia that will bear the largest proportional burden.
The 2026 GPI calculates that successful diplomacy to end the Iran war could be worth more than US$2.2 trillion to the global economy in a single year. That is the direct economic dividend of the gap between Scenario 2 and Scenario 3, between a fragile ceasefire and a resumed war. It does not include the longer-term costs: the future viability of the Strait of Hormuz as a trade route, sustained shocks to global fertiliser and petrochemical supply chains, or the damage to sovereign debt markets still feeding through in 2027.
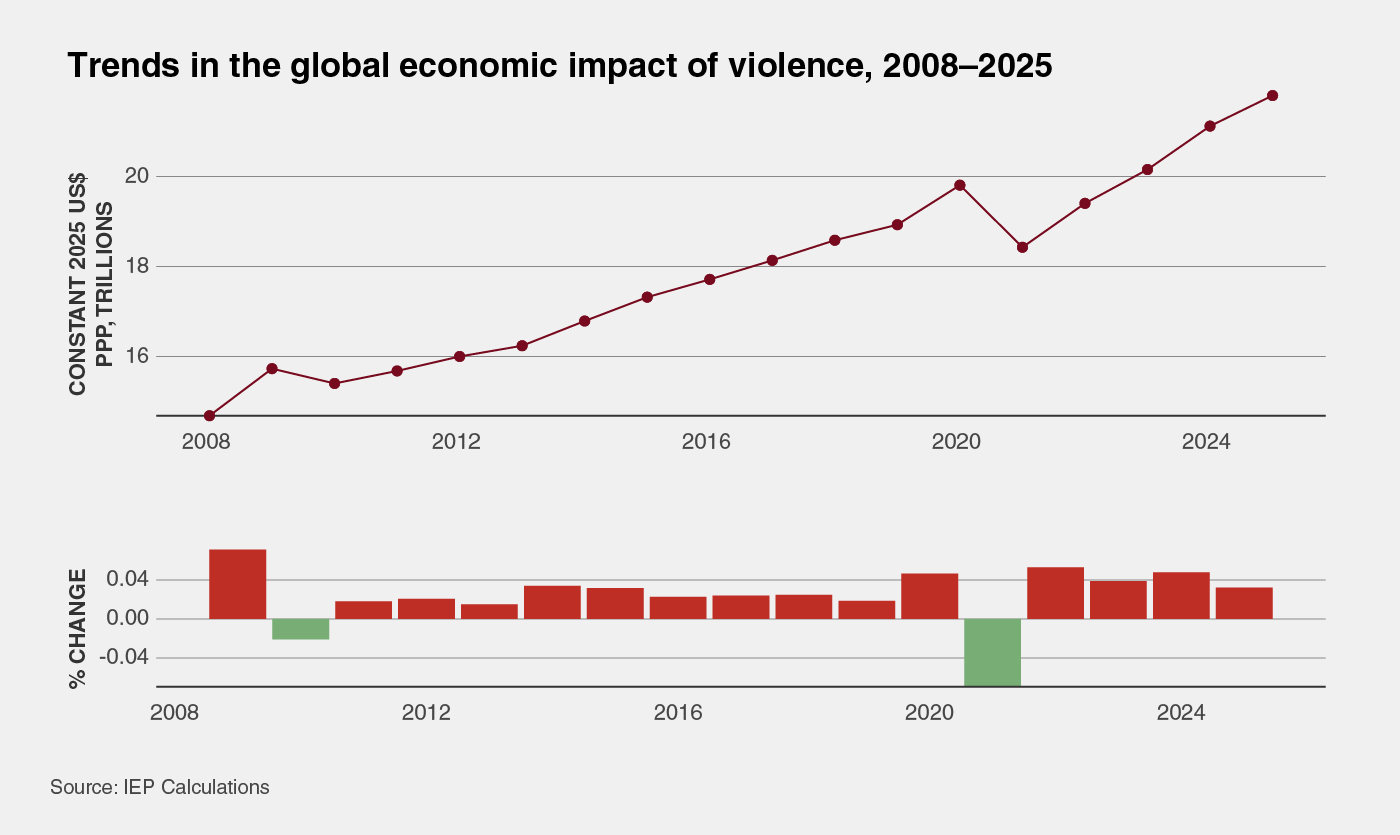
IEP’s broader measure of the global economic impact of violence, which reached US$21.8 trillion in 2025, equivalent to 10.5 per cent of global GDP (calculated using purchasing power parity (PPP) in constant dollars), provides context that the Iran war is not an isolated event, but rather has accelerated a decade-long trend of rising conflict costs, driven by military expenditure, displacement, and GDP losses. The economic impact of armed conflict has more than tripled since 2008.
— Download the Global Peace Index 2026 Press Release
— Request a Media Interview
— View the Global Peace Index 2026 interactive map
Global peacefulness deteriorated for the 12th consecutive year, with the number of active, state-based conflicts reaching 61. This is the highest...

Artificial Intelligence is transforming how peace and conflict are conducted, observed, and analysed. Between 2022 and 2026, the conflicts in Gaza,...
Identifying and measuring the factors that drive peace
Identifying and measuring the factors that drive peace