Gauging global arms production is not easy. When the most reliable source of data reports by company, rather than country, it’s difficult to determine globality. While there are readily available data sources for global military spending and the trade in major weapons, for instance from SIPRI, no comparable information is available for arms production worldwide.
There is a data source which sometimes is mistaken to be about national arms production: the SIPRI TOP 100 list of arms producing companies. This list’s unit of reporting is companies, not industries or countries. Therefore, data aggregated for all companies with its headquarters in one country regularly does not correspond to national arms production, as some of the production is sold abroad.
Furthermore, in many countries, smaller arms producing companies combine to produce a large share of national arms supply, but none of them makes it into the SIPRI TOP 100 list. Still, the SIPRI Top 100 list provides much insight into the global arms industry, including its composition and relative importance of companies.
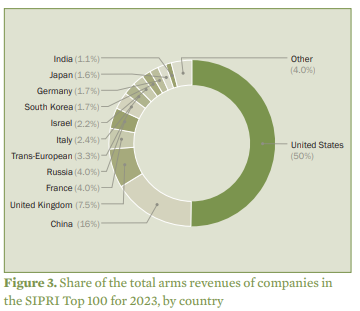
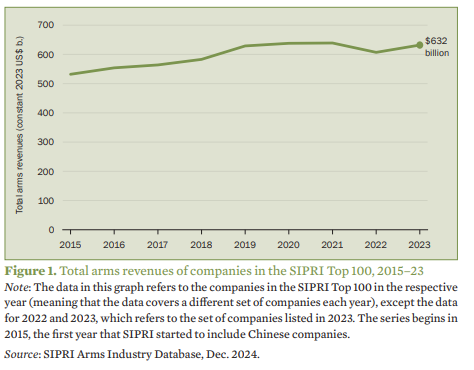
The SIPRI Top 100 Arms-Producing and Military Services Companies 2023/2024 report shows that the global arms industry remains less concentrated than many comparable civilian industries. Total arms revenues of the Top 100 companies reached $632 billion in 2023, reflecting a strong increase in demand for weapons and military equipment fuelled by heightened global geopolitical tensions.
Concentration has declined since the early 2000s, with the share of the top five companies among the Top 100 down from 45% in 2002 to approximately 37% in 2016 and 31.4% in 2023.
Concentration rates for the civilian side of major arms producing companies remain higher than that for arms production. For instance, the aerospace and defense sector’s civilian side, encompassing commercial aviation, satellite manufacturing, and related services, is dominated by a few major players like Boeing, Airbus, and Lockheed Martin. These companies hold substantial market shares, leading to higher concentration levels compared to the arms production sector.
Even the largest arms producers in the world have small turnover compared to major companies in civilian industries.
In 2023, the combined arms revenues of the world’s 100 largest arms-producing and military services companies reached $632 billion, a 4.2% increase from the previous year. While substantial, this figure is modest compared to the revenues of leading civilian companies. For instance, Walmart, the world’s largest company by revenue, reported $611 billion in 2023 .
With their arms sales, only the six arms producers in the SIPRI list, Lockheed Martin Corp., RTX, Northrop Grumman Corp., Boeing, General Dynamics and BAE systems made it onto the list of the Fortune Global 500.
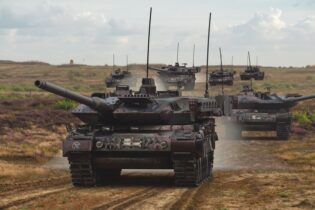
With the exception of a few countries, including Israel, Russia and USA, the arms industry is a comparatively small industrial sector. Its political importance is obviously higher. One major reason for the comparatively low degree of concentration of the global arms industry is the preference given by most governments to procurement of weapons from national sources.
This is quite different from customer behavior in most industrial markets, at least until the recent swing towards ‘national first’ in some countries, most prominently in the United States.
Another expression of the parochial nature of many arms markets is the arms import ratio, the proportion of national arms demand met by imports. Countries with major arms industries often source most of their defence equipment domestically.
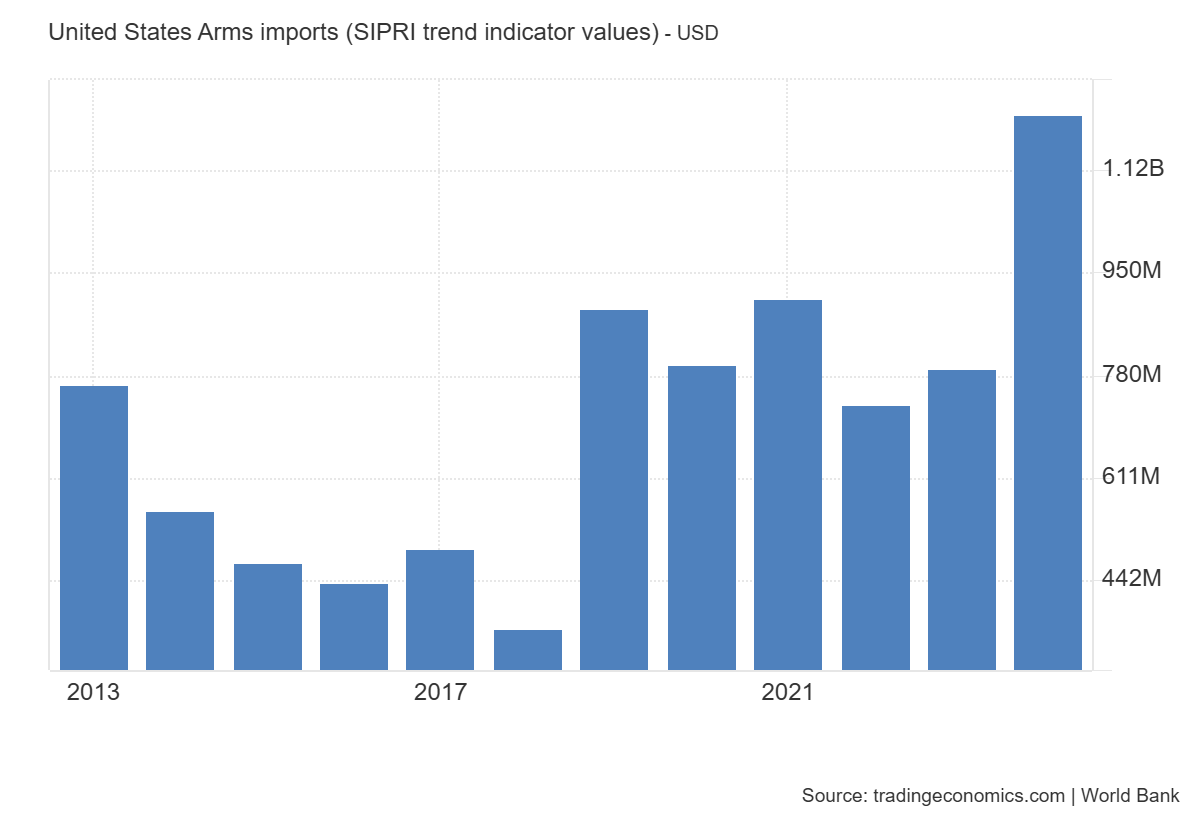
Despite being the largest arms exporter globally, the U.S. maintains a relatively low arms import ratio. In 2024, the U.S. imported approximately $1.21 billion worth of arms, accounting for less than 1% of its national demand for military equipment. This figure underscores the nation’s self-reliance in defense procurement, with most of its military needs met through domestic production.
While the U.S. remains largely self-sufficient, other countries with significant arms industries also exhibit varying degrees of import reliance:
For detailed data and further insights into international arms transfers, you can explore the SIPRI Arms Transfers Database.
There is comparatively little international intra-industry trade in arms. Few countries are both major exporters and importers of arms. One often-used measure of intra-industry trade is the Grubel-Lloyd Index.
The Grubel-Lloyd Index (GLI) measures the extent of intra-industry trade, which occurs when a country simultaneously imports and exports similar goods within the same industry. The index is calculated as:
*Calculated (within a specific category of goods) as 1- (│Exports-Imports│)/(Exports + Imports)
A GLI value close to 1 indicates a high level of intra-industry trade, meaning the country exports and imports similar quantities of goods in that industry. A GLI value close to 0 suggests that the country is predominantly involved in inter-industry trade, exporting or importing different types of goods.
While for most major industrialised countries the Index for most categories of manufacturing goods is well above 0.5, which implies that imports and exports of goods in this category are not overly different, for arms it was as low as 0.09 for the United States, and even in Germany, which had the highest ration, it was below 0.4 in 2015.
In order to determine further the extent to which governments, who are the prime actor in arms markets, prefer domestic to foreign arms, and thus limit the degree to which arms industries are globalised, more information on domestic arms production is needed.
The SIPRI TOP 100 data is useful but limited to aspects that can be investigated with the help of company data. More national or sectoral, data could improve our understanding of global military affairs.
Particularly when combined with other available data, such as data on military expenditures and the arms trade, the data could provide additional information about relative sizes of national arms production as well as differences among countries with respect to the degree of self-sufficiency in military matters.
Reliable estimates of global arms production remain challenging due to limited availability of comprehensive data. Current information is primarily drawn from military expenditures, arms transfers, and the SIPRI Top 100 arms-producing companies, which rely on open sources such as company reports and media publications.
Participation in multilateral transparency instruments has declined in recent years, and only a few states provide detailed and comprehensive data. This makes it difficult to fully assess global or regional armament developments.
Enhancing transparency will require greater participation in existing reporting mechanisms and the development of non-governmental monitoring tools to track arms procurement trends. Such initiatives would improve the reliability of global estimates, support policy-making, and foster confidence among stakeholders in the arms industry.
The SIPRI Top-100 Arms-Producing and Military-Services Companies report is updated regularly and provides the most current company-level snapshot of arms sales and trends. For the latest dataset, interactive charts, and fact sheets, consult SIPRI Arms Industry Database.
The table below presents the top 100 arms-producing and military services companies globally for the year 2023, as compiled by the Stockholm International Peace Research Institute (SIPRI). Revenue figures are in millions of constant (2023) US dollars and are rounded to the nearest $10 million.
| Rank 2023 | Rank 2022 | Company | Country | Arms Revenues 2023 | Arms Revenues 2022 | Change (%) | Total Revenues 2023 | Arms Revenues % of Total |
|---|---|---|---|---|---|---|---|---|
| 1 | 1 | Lockheed Martin Corp. | United States | 60,810 | 61,820 | -1.6 | 67,570 | 90 |
| 2 | 2 | RTX | United States | 40,660 | 41,190 | -1.3 | 68,920 | 59 |
| 3 | 3 | Northrop Grumman Corp. | United States | 35,570 | 33,620 | 5.8 | 39,290 | 91 |
| 4 | 4 | Boeing | United States | 31,100 | 30,500 | 2.0 | 77,790 | 40 |
| 5 | 5 | General Dynamics Corp. | United States | 30,200 | 29,270 | 3.2 | 42,270 | 71 |
| 6 | 6 | BAE Systems | United Kingdom | 29,810 | 29,150 | 2.3 | 30,350 | 98 |
| 7 | 9 | Rostec | Russia | 21,730 | 14,550 | 49 | 33,430 | 65 |
| 8 | 8 | AVIC | China | 20,850 | 19,750 | 5.6 | 83,430 | 25 |
| 9 | 7 | NORINCO | China | 20,560 | 21,130 | -2.7 | 76,600 | 27 |
| 10 | 10 | CETC | China | 16,050 | 14,260 | 13 | 55,990 | 29 |
| 11 | 13 | L3Harris Technologies | United States | 14,760 | 13,150 | 12 | 19,420 | 76 |
| 12 | 14 | Airbus Trans-European | Trans-European | 12,890 | 13,090 | -1.5 | 70,710 | 18 |
| 13 | 12 | Leonardo | Italy | 12,390 | 13,980 | -11 | 16,520 | 75 |
| 14 | 11 | CASC | China | 12,350 | 13,370 | -7.6 | 41,170 | 30 |
| 15 | 16 | CSSC | China | 11,480 | 10,000 | 15 | 48,950 | 23 |
| 16 | 17 | Thales | France | 10,350 | 10,110 | 2.4 | 19,910 | 52 |
| 17 | 18 | HII | United States | 9,280 | 9,110 | 1.9 | 11,450 | 81 |
| 18 | 15 | CASIC | China | 8,850 | 11,270 | -21 | 27,640 | 32 |
| 19 | 19 | Leidos | United States | 8,730 | 8,580 | 1.7 | 15,440 | 57 |
| 20 | 21 | Booz Allen Hamilton | United States | 6,900 | 6,140 | 12 | 10,660 | 65 |
| 21 | 20 | Amentum | United States | 6,450 | 6,830 | -5.6 | 8,600 | 75 |
| 22 | 23 | Rolls-Royce | United Kingdom | 6,290 | 6,140 | 2.4 | 19,120 | 33 |
| 23 | 24 | AECC | China | 5,780 | 4,920 | 17 | ||
| 24 | 42 | Hanwha Group | South Korea | 5,710 | 3,740 | 53 | 61,300 | 9.3 |
| 25 | 27 | CACI International | United States | 5,700 | 5,020 | 14 | 7,660 | 74 |
| 26 | 29 | Rheinmetall | Germany | 5,480 | 4,970 | 10 | 7,750 | 71 |
| 27 | 26 | Elbit Systems | Israel | 5,380 | 4,710 | 14 | 5,980 | 90 |
| 28 | 22 | CSGC | China | 5,130 | 5,630 | -8.9 | 43,930 | 12 |
| 29 | 28 | Honeywell International | United States | 4,990 | 4,820 | 3.5 | 36,660 | 14 |
| 30 | 33 | MBDA | Trans-European | 4,760 | 4,740 | 0.4 | 4,810 | 99 |
| 31 | 32 | General Electric | United States | 4,710 | 4,590 | 2.6 | 67,950 | 6.9 |
| 32 | 30 | Naval Group | France | 4,550 | 4,860 | -6.4 | 4,600 | 99 |
| 33 | 36 | Safran | France | 4,510 | 4,510 | 0.0 | 25,060 | 18 |
| 34 | 37 | Israel Aerospace Industries | Israel | 4,490 | 3,890 | 15 | 5,330 | 84 |
| 35 | 40 | Saab | Sweden | 4,360 | 3,760 | 16 | 4,850 | 90 |
| 36 | 35 | KBR | United States | 4,230 | 4,440 | -4.7 | 6,960 | 61 |
| 37 | 38 | Sandia National Laboratories | United States | 4,200 | 4,080 | 2.9 | 4,780 | 88 |
| 38 | 41 | Babcock International Group | United Kingdom | 4,030 | 3,990 | 1.0 | 5,450 | 74 |
| 39 | 45 | Mitsubishi Heavy Industries | Japan | 3,890 | 3,140 | 24 | 33,210 | 12 |
| 40 | 39 | Science Applications International Corp. | United States | 3,870 | 3,930 | -1.5 | 7,440 | 52 |
| 41 | 34 | United Shipbuilding Corp. | Russia | 3,770 | 3,700 | 1.9 | 4,710 | 80 |
| 42 | 44 | Rafael | Israel | 3,730 | 3,210 | 16 | 3,810 | 98 |
| 43 | 43 | Hindustan Aeronautics | India | 3,710 | 3,470 | 6.9 | 3,910 | 95 |
| 44 | 53 | V2X | United States | 3,410 | 2,620 | 30 | 3,960 | 86 |
| 45 | 46 | KNDS | Trans-European | 3,340 | 3,470 | -3.7 | 3,510 | 95 |
| 46 | 25 | Dassault Aviation Group | France | 3,220 | 5,440 | -41 | 5,190 | 62 |
| 47 | 52 | NCSIST | Taiwan | 3,220 | 2,530 | 27 | 3,360 | 96 |
| 48 | 51 | Bechtel Corp. | United States | 2,970 | 2,850 | 4.2 | 20,600 | 14 |
| 49 | 47 | Textron | United States | 2,940 | 3,030 | -3.0 | 13,680 | 21 |
| 50 | 48 | CEA | France | 2,900 | 2,990 | -3.0 | 6,560 | 44 |
| 51 | 50 | Fincantieri | Italy | 2,820 | 3,000 | -6.0 | 8,270 | 34 |
| 52 | 55 | Parker-Hannifin Corp. | United States | 2,600 | 2,360 | 10 | 19,930 | 13 |
| 53 | 54 | TransDigm Group | United States | 2,570 | 2,430 | 5.8 | 6,590 | 39 |
| 54 | 62 | ASELSAN | Türkiye | 2,440 | 2,170 | 12 | 2,560 | 95 |
| 55 | 60 | Jacobs Engineering Group | United States | 2,350 | 2,180 | 7.8 | 16,350 | 14 |
| 56 | 75 | Korea Aerospace Industries | South Korea | 2,290 | 1,580 | 45 | 2,910 | 79 |
| 57 | 66 | Serco Group | United Kingdom | 2,280 | 2,000 | 14 | 6,640 | 34 |
| 58 | 57 | ST Engineering | Singapore | 2,230 | 2,360 | -5.5 | 7,520 | 30 |
| 59 | 68 | Atomic Weapons Establishment | United Kingdom | 2,230 | 1,930 | 16 | 2,260 | 99 |
| 60 | 84 | JSC Ukrainian Defense Industry | Ukraine | 2,210 | 1,310 | 69 | 2,210 | 100 |
| 61 | 58 | General Atomics | United States | 2,120 | 2,230 | -4.9 | ||
| 62 | 61 | Teledyne Technologies | United States | 2,110 | 2,100 | 0.5 | 5,640 | 37 |
| 63 | 59 | Oshkosh Corp. | United States | 2,100 | 2,230 | -5.8 | 9,660 | 22 |
| 64 | 73 | PGZ | Poland | 2,060 | 1,890 | 9.0 | 2,290 | 90 |
| 65 | 67 | Kawasaki Heavy Industries | Japan | 2,060 | 1,770 | 16 | 13,190 | 16 |
| 66 | 64 | ThyssenKrupp | Germany | 1,990 | 2,110 | -5.7 | 40,550 | 4.9 |
| 67 | 65 | Bharat Electronics | India | 1,940 | 1,930 | 0.5 | 2,400 | 81 |
| 68 | 74 | Sierra Nevada Corp. | United States | 1,930 | 1,620 | 19 | 1,990 | 97 |
| 69 | 79 | Baykar | Türkiye | 1,900 | 1,520 | 25 | 2,000 | 95 |
| 70 | 70 | BWX Technologies | United States | 1,890 | 1,770 | 6.8 | 2,500 | 76 |
| 71 | 83 | Fujitsu | Japan | 1,850 | 1,230 | 50 | 26,790 | 6.9 |
| 72 | 72 | QinetiQ | United Kingdom | 1,850 | 1,760 | 5.1 | 2,370 | 78 |
| 73 | 71 | Hensoldt | Germany | 1,850 | 1,810 | 2.2 | 2,000 | 93 |
| 74 | 63 | CNNC | China | 1,840 | 1,860 | -1.1 | 39,680 | 4.6 |
| 75 | 76 | Parsons Corp. | United States | 1,840 | 1,600 | 15 | 5,440 | 34 |
| 76 | 69 | LIG Nex1 | South Korea | 1,770 | 1,760 | 0.6 | 1,770 | 100 |
| 77 | 77 | Eaton | United States | 1,710 | 1,580 | 8.2 | 23,200 | 7.4 |
| 78 | 88 | Turkish Aerospace Industries | Türkiye | 1,700 | 1,170 | 45 | 2,210 | 77 |
| 79 | 81 | Curtiss-Wright Corp. | United States | 1,580 | 1,450 | 9.0 | 2,850 | 55 |
| 80 | 85 | Kongsberg Gruppen | Norway | 1,500 | 1,180 | 27 | 3,840 | 39 |
| 81 | 87 | Amphenol Corp. | United States | 1,380 | 1,190 | 16 | 12,560 | 11 |
| 82 | 80 | CAE | Canada | 1,370 | 1,420 | -3.5 | 3,170 | 43 |
| 83 | 98 | Diehl | Germany | 1,350 | 1,040 | 30 | 4,200 | 32 |
| 84 | 86 | Keysight Technologies | United States | 1,250 | 1,220 | 2.5 | 5,460 | 23 |
| 85 | 82 | Moog | United States | 1,240 | 1,330 | -6.8 | 3,320 | 37 |
| 86 | 115 | ViaSat | United States | 1,230 | 1,210 | 1.7 | 4,280 | 29 |
| 87 | 105 | Hyundai Rotem | South Korea | 1,210 | 840 | 44 | 2,750 | 44 |
| 88 | 94 | Navantia | Spain | 1,190 | 1,050 | 13 | 1,550 | 77 |
| 89 | 107 | Czechoslovak Group | Czechia | 1,190 | 950 | 25 | 1,870 | 64 |
| 90 | 90 | Melrose Industries | United Kingdom | 1,190 | 1,150 | 3.5 | 4,160 | 29 |
| 91 | 117 | NEC Corp. | Japan | 1,140 | 620 | 84 | 24,800 | 4.6 |
| 92 | 92 | Fluor Corp. | United States | 1,110 | 1,070 | 3.7 | 15,470 | 7.2 |
| 93 | 93 | Mitre Corp. | United States | 1,100 | 1,060 | 3.8 | 2,360 | 47 |
| 94 | 96 | Mazagon Dock Shipbuilders | India | 1,090 | 970 | 12 | 1,150 | 95 |
| 95 | 91 | The Aerospace Corp. | United States | 1,060 | 1,080 | -1.9 | 1,290 | 82 |
| 96 | 118 | Mitsubishi Electric Corp. | Japan | 1,050 | 620 | 69 | 37,500 | 2.8 |
| 97 | 103 | HEICO Corp. | United States | 1,040 | 900 | 16 | 2,970 | 35 |
| 98 | 89 | United Launch Alliance | United States | 1,030 | 1,110 | -7.2 | ||
| 99 | 101 | Howmet Aerospace | United States | 1,020 | 960 | 6.3 | 6,640 | 15 |
| 100 | 102 | TTM Technologies | United States | 1,010 | 900 | 12 | 2,230 | 45 |

The demand for rising defence budgets across NATO has sparked calls to brand arms spending as eligible for inclusion under ESG criteria. Proponents...
As geopolitical tensions escalate, European leaders are signalling a shift in their approach to security, emphasizing self-reliance and increased...

Exploring military capacity and capability
Identifying and measuring the factors that drive peace