Positive Peace is transformational, but it can take years for even small shifts in society to show. We take a look at some changes over the last decade.
![Long-Term Positive Peace Trends in Three Charts [2009-2018]](https://www.visionofhumanity.org/wp-content/uploads/2020/11/protest_covid_era-scaled-850x470.jpg)
We take a look at postiive peace trends over the last decade from 2009 to 2018 in three detailed charts and summarise the key findings.
In 2020, COVID19 immediately upended societies worldwide, but the pandemic’s long-lasting effect on global levels of Positive Peace may take time to materialise.
The Institute for Economics and Peace (IEP) uses an empirical method to measure the eight Pillars of Positive Peace, which reflects gradual shifts within our complex global social system over time. Positive Peace trends over the last decade are visible.
Different to negative peace, which means the absence of violence, Positive Peace is a societal condition that creates an optimal environment for human potential to flourish and is associated with many desirable outcomes including:
More importantly, it provides a theory of social change, and explains how societies evolve.
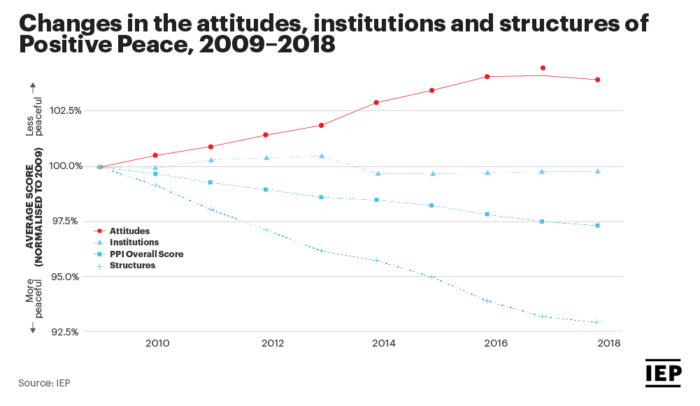
This chart shows that the improvement in the Positive Peace Index (PPI) since 2009, is largely driven by indicators from the Structures category, which improved by seven per cent on average since that year.
This means the underpinning of the socio-economic system, such as poverty and equality, or the result of aggregate activity, such as GDP, has been improving over this time.
While Structures has been improving each year, Attitudes has deteriorated each year to be 3.9 per cent worse than a decade ago. The indicators to show the biggest deteriorations in this area are quality of information, factionalised elites and hostility to foreigners.
Globally, institutional functioning has remained largely constant over the same period, except for some fluctuations during the international financial crises.
Positive Peace is defined as the attitudes, institutions and structures that create and sustain peaceful societies. Each of the 24 indicators across the eight Pillars of the Positive Peace Index can be categorised using this three-part typology.
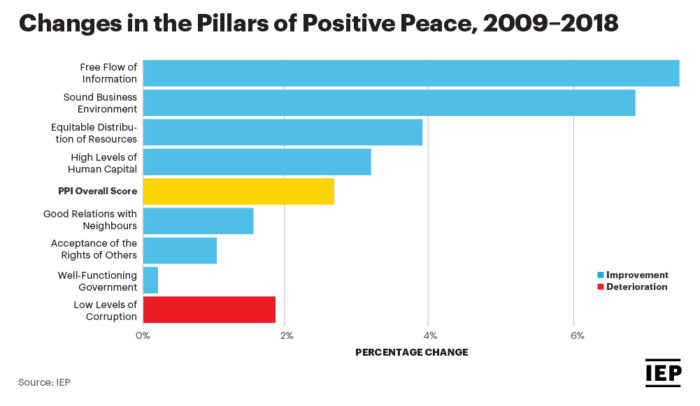
This chart shows the percentage change from 2009 to 2018 for all eight Pillars of Positive Peace. These scores reflect gradual changes within complex social systems and typically do not fluctuate drastically year to year.
As such, since 2009, the average Pillar score has changed by just 2.6 per cent, and no Pillar score has changed by more than eight per cent. While seven of the eight Pillars improved, the Low Levels of Corruption Pillar deteriorated.
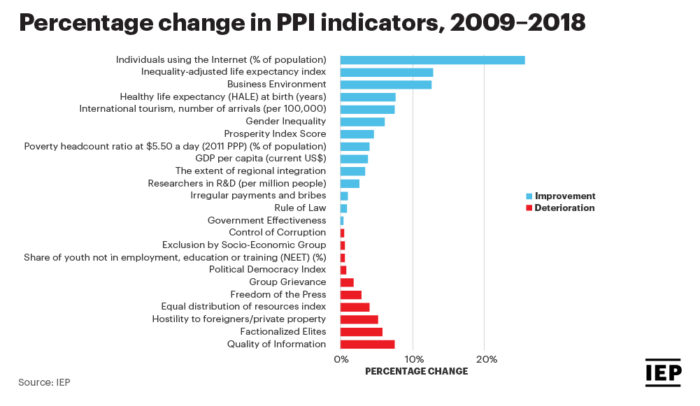
This chart shows that individual indicators change more quickly than the Pillars. Because Positive Peace works as a system where each factor affects the others, it is important to be aware of which indicators tend to change quickly or slowly.
For example, the average score for access to internet has improved by 27 per cent since 2009, indicating a rapid increase in access to information. At the other end of the spectrum, the use of disinformation by governments — quality of information — has deteriorated with the access to technology and as such the PPI score for this indicator has shown a deterioration of 10.4 per cent over the period.
The factionalised elites indicator with is a measure in the Low Levels of Corruption Pillar, measures “the fragmentation of state institutions along ethnic, class, clan, racial or religious lines,” it deteriorated by 7.8 per cent.
Positive Peace is measured by the Positive Peace Index (PPI), which consists of eight Pillars, each containing three indicators. This provides a baseline measure of the effectiveness of a country’s capabilities to build and maintain peace.
It also provides a measure for policymakers, researchers and corporations to use for effective monitoring and evaluation.
The eight Pillars or socio-economic areas measured by IEP, include: Well-Functioning Government; Equitable Distribution of Resources; Free Flow of Information; Good Relations with Neighbours; High Levels of Human Capital; Acceptance of the Rights of Others; Low Levels of Corruption; Sound Business Environment.

The Global Peace Index has developed a way to measure peace using a broad range of indicators.
![Predicting Peace and Conflict from 2008 to 2018 [Chart]](https://www.visionofhumanity.org/wp-content/uploads/2019/09/positive-peace-deficit-weekly-briefing-graphics-gpi2019-fig4.5-e1569816044883-3-315x210.jpg)
Countries that experience Positive Peace deficits are more likely to deteriorate into states of violence.
Analysing the factors that sustain peace.