The effects of climate change extend beyond the environmental impacts in a complex intersection with economics, social development and security.
![Climate Change Risk Level by Country in 5 Charts [2019]](https://www.visionofhumanity.org/wp-content/uploads/2019/07/Webp.net-resizeimage-3-1-2-scaled-850x470.jpg)
Climate change risk extends beyond environmental impacts in a complex intersection with economics, social development, security and peace.
The impacts of fluctuating climate conditions on societal stability and its potential to lead to violent conflict is of growing importance.
While long-term quantitative data available on the interactions of climate and peace is scarce. What we do know is that climate change is a threat multiplier. Climate pressures adversely influence resource availability, affect population dynamics, and strain societal institutions.
In turn, this can affect socioeconomic and political stability.
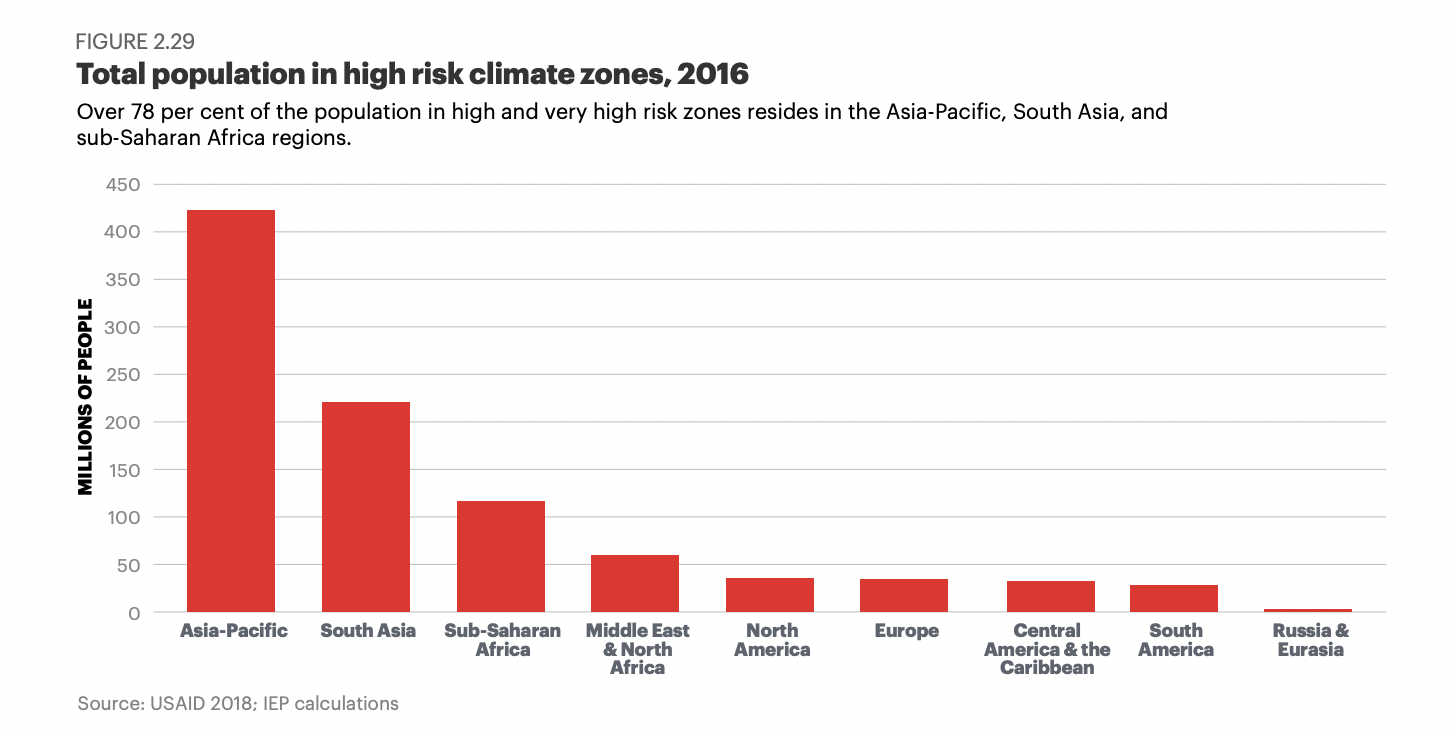
Climate change is a pervasive threat to global peacefulness. An estimated 971 million people live in areas with high or very high exposure to climate hazards globally, with every region having some portion of their population categorised as being at high exposure.
Of this number, 41 per cent reside in countries with low levels of peacefulness, while 22 per cent are in countries with high levels of peacefulness.
The Asia Pacific region houses twice as many people living in areas with high exposure than all other regions combined. The nine countries facing the overall highest risk to natural hazards are all in Asia.
Philippines tops the list, closely followed by Japan, and then Bangladesh, Myanmar, China, Indonesia, India, Vietnam and Pakistan.
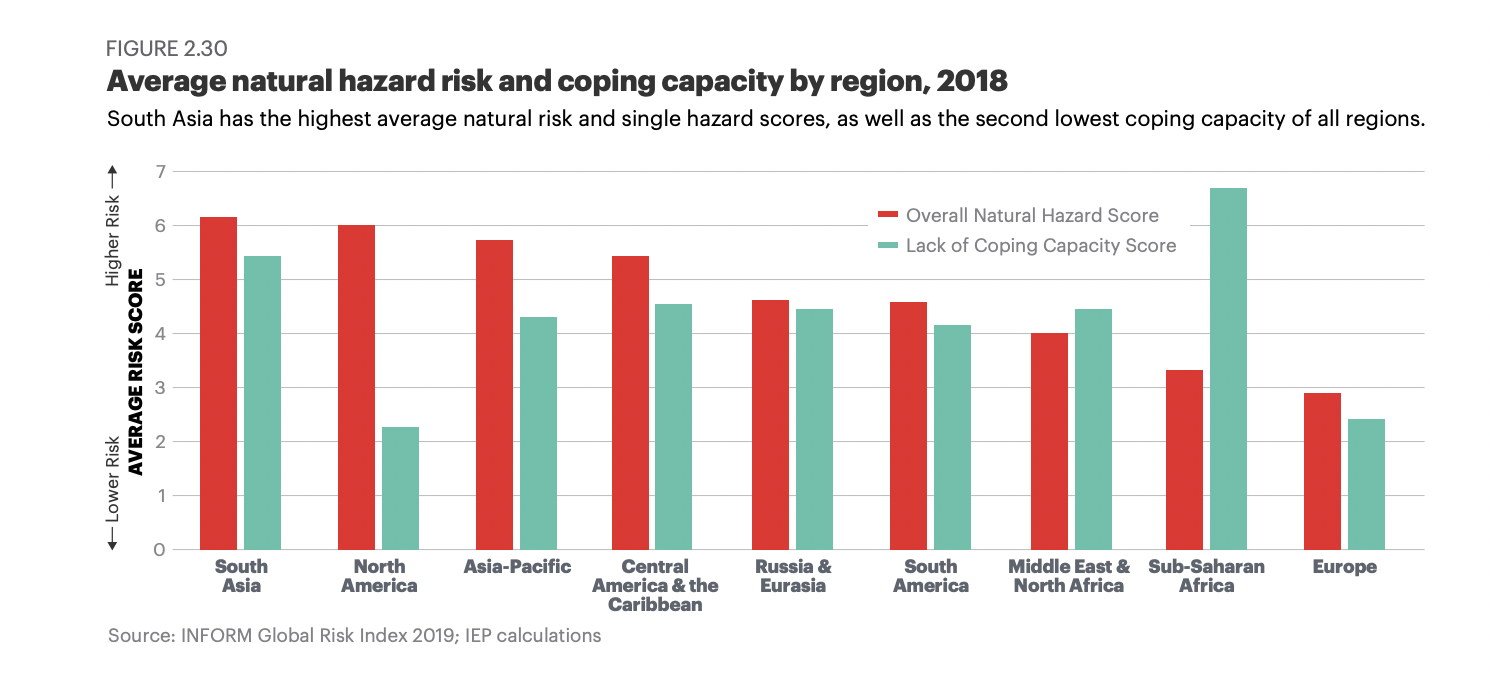
Coping capacity measures the availability of resources that can alleviate the impact of disaster. A higher score indicates a weaker capacity, which yields more opportunity for tensions to overflow.
The two regions that would theoretically fare best in a natural disaster are North America and Europe. North America has the highest coping capacity paired with the second highest natural hazard risk.
Europe has the lowest natural hazard risk score and the second highest coping capacity.
South Asia has the highest risk to natural hazards and the second lowest coping capacity of all regions.
Sub-Saharan Africa stands out due to its lack of coping capacity, which could exacerbate climate-related violent conflicts. There are 122 million people at risk in the region, which has the third highest water-related risk, threatening livelihood security.
Of the 971 million people at risk of climate hazards, 400 million live in countries with low levels of peacefulness, and therefore a reduced resilience to conflict.
Of the 76 countries that deteriorated in peacefulness over the past year, 91 per cent have high or very high risk to a climate hazard such as a tsunami, flood, tropical cyclone or drought.
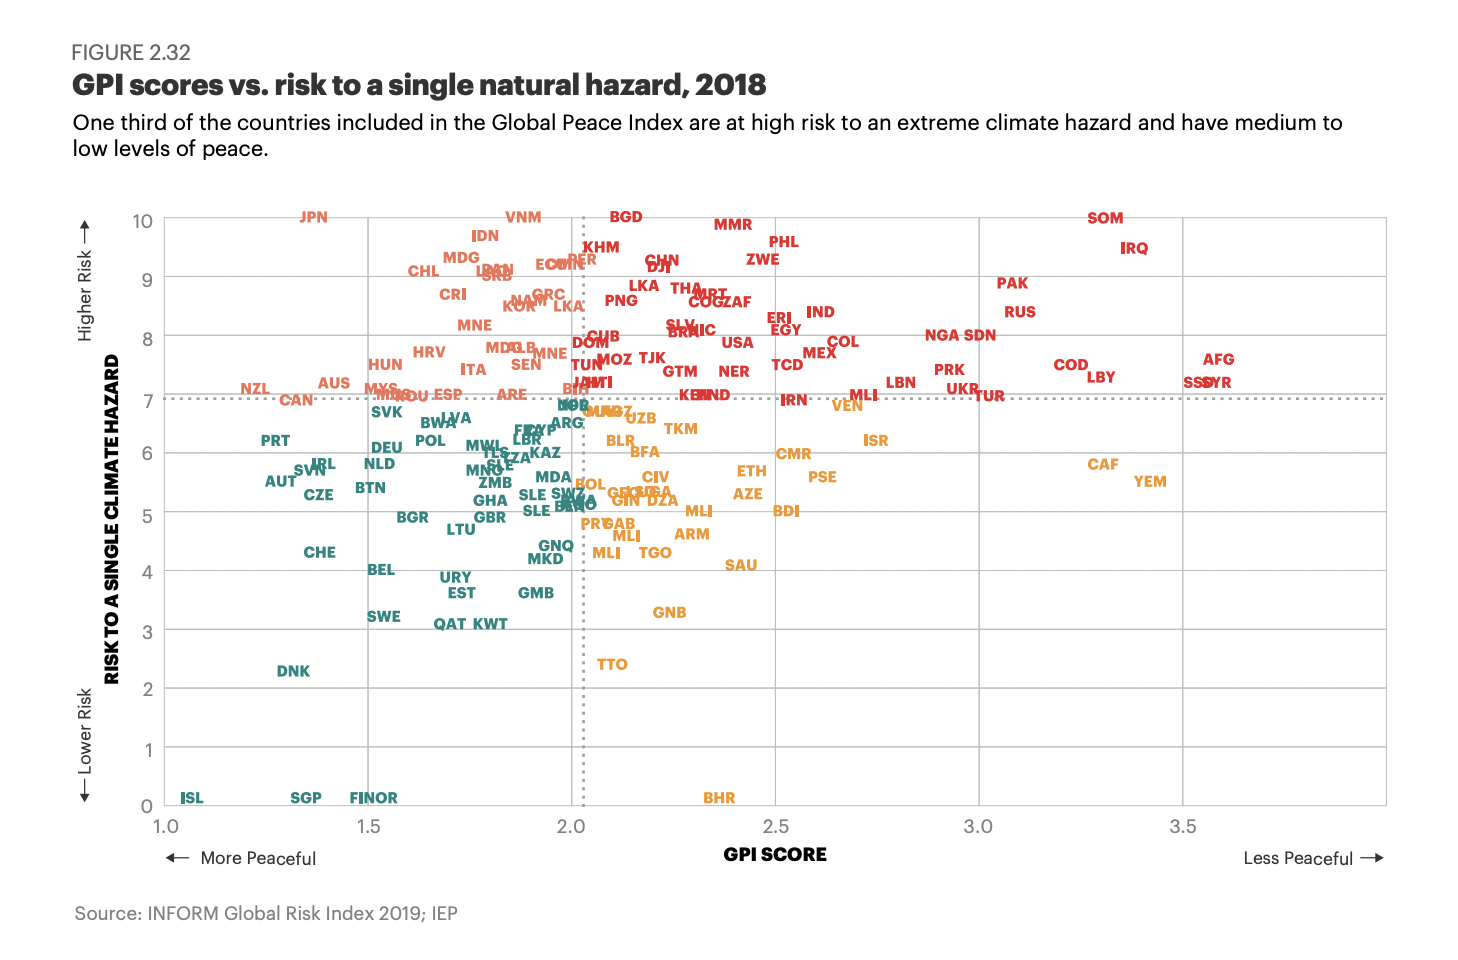
One third of the 161 countries analysed have low risk of severe climate impacts and related conflict.
Shown in green on the scatterplot, these countries have a relatively low risk to climate hazards and relatively high levels of peacefulness – Iceland, Singapore, Finland and Denmark lead the way.
Another third, however, have a high risk to extreme climate hazards as well as low levels of peacefulness, making them most at risk to conflicts spurred or exacerbated by climate change.
Japan and Somalia both have a single hazard score of ten, the maximum level of risk. However, Japan, a very high peace country, has the tenth highest coping capacity of all recorded countries, while Somalia, a country with very low peace, has the second lowest coping capacity.
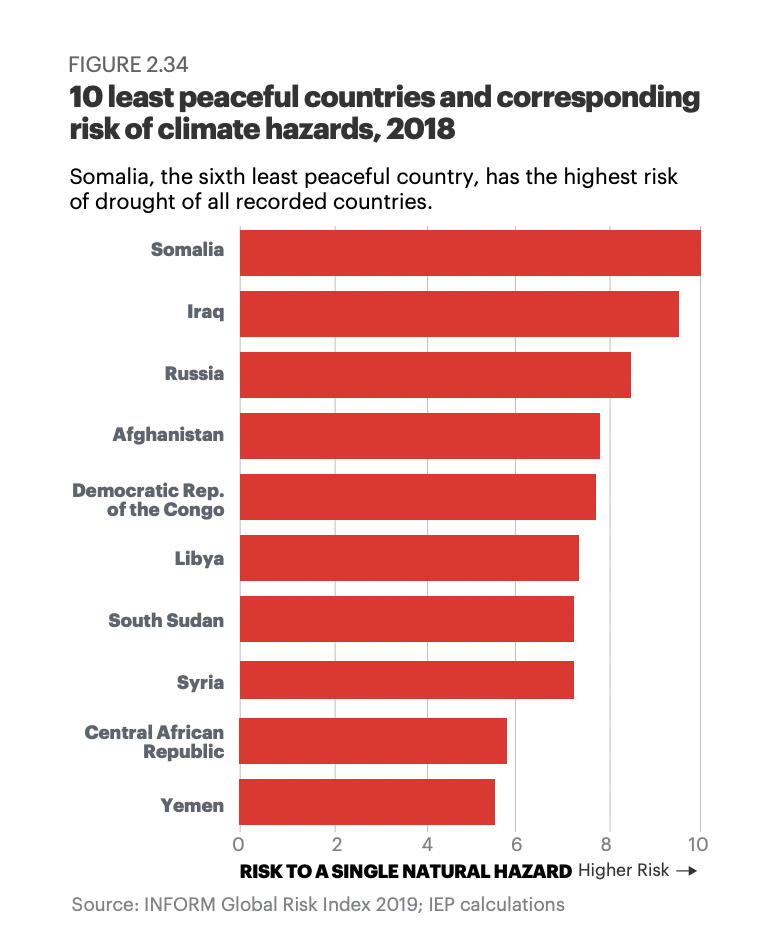
This chart shows the ten countries with the lowest levels of peacefulness and their corresponding risk to an extreme climate hazard.
In Afghanistan, Somalia and Syria, drought is of primary concern, while Libya and Yemen face high risk of tsunamis.
Russia, South Sudan, Iraq, the Democratic Republic of the Congo and the Central African Republic are at the highest risk of severe flooding.
Somalia and Iraq stand out as being particularly vulnerable to conflict exacerbated by climate change, as they both have very high risks of climate hazards but also both rank amongst the five least peaceful countries.
Based on their level of peacefulness, all ten countries in the chart have minimal capacity to peacefully and sustainably respond to climate hazards, which yields more opportunity for tensions to overflow in already fragile circumstances.
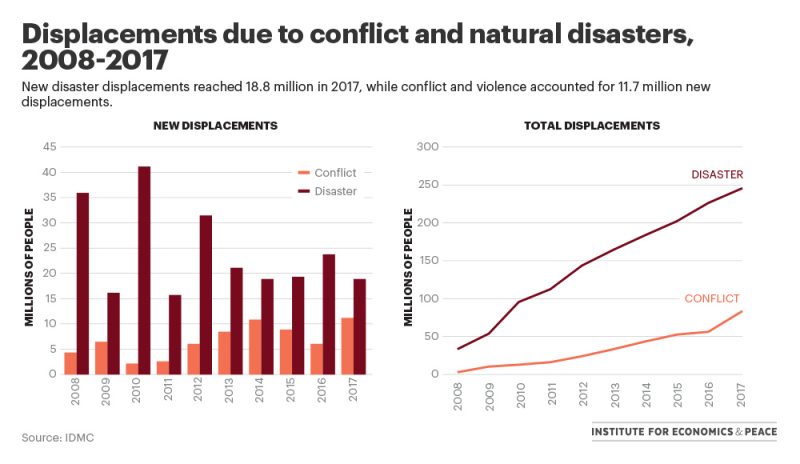
There is a strong relationship between extreme weather events and displacement.
In 2017, 18.8 million people were estimated to be displaced due to natural disasters globally. The bar chart compares the number of displacements attributed to conflict and natural disasters.
This chart shows 2010 was the year with the greatest number of displacements.
The adjacent line chart shows that despite 2017 recording less than half of the amount of displacements caused by climate than 2010, there are more displacements than ever before. This indicates the global rate of displacements far exceeds the rate of repatriation.
Climate change related hazards continue to put pressure on fragile communities and the efficiency of repatriating displaced persons continues to lag behind the waves of new displacements. It is expected the number of newly coined ‘climate refugees’ will climb.